
Author: Leilah J Dare / Editor: Jason Kendall / Reviewer: Joe Schrieber / Codes: CC1, CC12, CC8, ResC10, SLO1 / Published: 05/04/2023
The need to establish the correct diagnosis in patients who have ST segment elevation on their ECG is paramount when considering that the most important differential is ST elevation Myocardial Infarction (STEMI). There are 2 main issues when trying to diagnose STEMI: (i) the speed with which we need to make the diagnosis because of the time critical nature of treatment and (ii) the potential consequences of inappropriate urgent reperfusion therapy (i.e. thrombolysis or angioplasty).
The interpretation of the ECG is usually made under time pressure and without the luxury of added investigations to help clarify the diagnosis. Consequently we need to rely on our clinical assessment (ie history and examination) of the patient in conjunction with our interpretation of the ECG in order to make the correct diagnosis.
There are a large number of causes of ST segment elevation without infarction. The aim of this learning module is to review the conditions which are likely to mimic STEMI. Many are primarily cardiac in origin (e.g. benign early repolarisation (BER), Brugada Syndrome, or pericarditis) but many are not (e.g. hyperkalaemia or pulmonary embolism).
There is evidence available which demonstrates that ECG interpretation is not perfect. One study evaluating the pre-hospital recognition of ST elevation meeting criteria for thrombolysis showed that 51% did not have myocardial infarction as their final diagnosis1. A further study reported that correct differentiation of BER from STEMI by a group of emergency physicians and cardiologists occurred in 81% and 90% of cases respectively2. The authors concluded that the cardiologists had significantly more years of experience and that this was why they were more accurate in making the correct diagnosis.
Learning Bite
The ability to recognize BER from STEMI is not always straightforward and is in part related to clinician experience and clinical context
The causes of ST segment elevation (see Table 1)
This learning module discusses the cardiac causes of ST segment elevation unrelated to acute myocardial infarction (MI) and the non-cardiac causes which might present similarly to MI (i.e. with collapse or chest pain: subarachnoid haemorrhage or pulmonary embolism) or which might complicate MI (e.g. hyperkalaemia).
Table 1: Pathological Causes of ST elevation

Learning Bite
There are many causes of ST segment elevation which are not related to acute myocardial infarction
Recognition of ST segment elevation
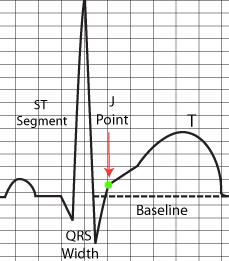
The ST segment represents completed ventricular myocardial depolarization. This segment can be FLAT (see Figure 1), or can be sloping (see Figure 3).
The European Society of Cardiology4 defines the height of ST elevation in AMI as being measured at the J point (see Figures 1-4). One study demonstrated how measuring the height of the ST segment is highly variable between Junior Doctors5, with the point of measurement varying by up to 5 mm beyond the J point (see Figure 4).
Learning Bite
Measuring ST segment elevation needs to occur at the J point
Figure 1: components of the ECG – identification of the J point

Three questions are important in evaluating the ST segment:
- Where is the baseline?
- What is the J point?
- Where along the ST segment do we measure?
Where is the baseline?
ST segment elevation is defined as deviation of the ST segment by greater than 0.1mV above a line joining 2 successive TP segments3; if the TP segment is not clearly identifiable then the PR segment can be used (see Figure 2).
Figure 2: Demonstrating the baseline

What is the J point?
This is defined as the junction between the QRS complex and the ST segment (see Figure 3).
Figure 3
Where along the ST segment do we measure elevation?
This is not so clear-cut: measuring the height of a flat ST segment (eg. in Figure 1) will be straightforward but the same cannot be said for a sloping ST segment (eg. in Figure 2).
Figure 4: Demonstrating variability in measuring the J point

Recognition of ST segment elevation without infarction
(i) ST segment morphology (i.e. shape – see Figure 5):
BER has elevated upward sloping concave ST segements3. This concave nature cannot be used as a discriminator on its own but when seen in conjunction with the other features of BER it may be of help. Pericarditis is also associated with a concave ST morphology; in pericarditis, this “saddle shape” is characteristically seen globally throughout the ECG.
Figure 5: ST segment morphology

It has been reported that a non-concave (i.e. convex) morphology has a sensitivity of 77% and a specificity of 97% for a diagnosis of STEMI. This means that a convex or flat morphology can be used as a “rule in” feature for AMI but that morphology alone is a poor feature to use to “rule out” AMI6.
Learning Bite
A convex ST segment shape is more likely to be associated with AMI than a concave shape
Pitfall
However,do not assume that because ST segment elevation is not convex that it cannot be a STEMI
(ii) Distribution of ST segment elevation:
ST segment elevation due to STEMI follows a coronary artery “territorial” distribution which is not typically seen in other conditions. It may also be accompanied by reciprocal changes: seen in 70% of inferior and 30% of anterior STEMI6 (see Figure 6).
ST segment elevation due to BER is typically evident in the precordial leads: 74% in V1-V2, 73% in V3-V4 and 37% in inferior leads8.
ST segment elevation is more diffuse in pericarditis (see Table 2).
Figure 6: ST segment changes of STEMI (with reciprocal changes)
in a distribution clearly reflecting coronary artery territory

Table 2: Distribution of ST segment changes and association with cause

Learning Bite
Territorial ST segment elevation make AMI more likely; more diffuse ST segment changes are typical of pericarditis
(iii) Magnitude of ST segment elevation:
The magnitude of ST segment elevation can help to differentiate BER from STEMI: one study reported that 57% of ECGs showing ST elevation due to BER was of 1mV amplitude or less; where the amplitude was 5mV or greater it was due to BER in only 2% of cases.3
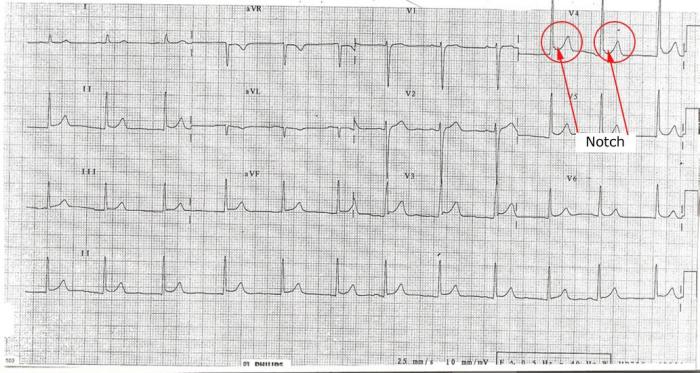
(iv) “Notch” or “Slur” at the end of the QRS (at the J point):
One of the features seen in BER is an upward sloping notch at the end of the QRS segment. This is seen more in the precordial leads in BER and is not a feature of pericarditis3 (see Figure 7).
Learning Bite
A notch at the end of the QRS segment is often seen in BER
Figure 7: Representation of notch at the end of the QRS complex
(v) ST segment elevation to T wave height ratio (see Figure 8):
Both BER and pericarditis can have ST segments and T waves that look morphologically similar making distinguishing between them difficult. Comparing the height of the ST segment to that of the T wave can aid in this process. This can be expressed as a ratio. The most useful place to measure this is in V6. When this ratio is greater than 0.25 it indicates the diagnosis of pericarditis is more likely with a positive predictive value of 90%9. It can be done in other leads but with less accuracy.
Learning Bite
The ST:T wave ratio in V6 of > 0.25 makes Pericarditis more likely
Figure 8: Demonstration of ST/T wave ratio measurement

(i) Normal variant / Benign Early Repolarisation (BER):
Hiss et al in 1960 studied the ECGs of 6014 healthy men in the US Air force. They found that 91% had ST segment elevation of 1mm to 3 mm in one or more precordial leads. This demonstrates the common nature of BER. The incidence of this finding decreases with age. Women demonstrate ST elevation of > 1mm in only 20% of cases and this does not appear to change with increasing age3. It is equally common in all races11. ST segment elevation due to BER reduces in amplitude during exercise – however, exercising people with ST elevation in order to confirm BER may be hazardous!
Learning Bite
BER is common especially at younger ages
(ii) Pericarditis:
5% of ED admissions with chest pain are due to acute pericarditis12. 90% of cases are classified as idiopathic or viral in aetiology. Table 3 lists the causes of pericarditis.
Table 3: Causes of pericarditis

85% of patients have an audible friction rub during the course of their diease. 15% of patients with idiopathic pericarditis and up to 60% of patients with neoplastic, TB or purulent pericarditis have clinical evidence of tamponade.
Learning Bite
85% of patients with pericarditis have a pericardial friction rub at some point during their illness
ECG findings include widespread concave ST elevation, ST depression in lead aVR and widespread PR depression. The ST segment to T wave height ratio in lead V6 is normally > 0.259.
Troponin levels are elevated in 35-50% of patients with pericarditis. Other blood tests (eg. full blood count, viral serology) are of little help in finding a cause. Echocardiography should be performed to aid diagnosis, evaluate the size of any associated effusion and to look for other poor prognostic indicators (Table 4).
Table 4: Poor prognostic indicators associated with pericarditis

The treatment for uncomplicated pericarditis is non-steroidal anti-inflammatory medication (NSAIDs) to relieve discomfort. Steroids are not to be used in the first instance for idiopathic pericarditis as they may increase the risk of recurrence. They may be used in pericarditis associated with systemic inflammatory disorders. Colchicine can be considered in conjunction with the NSAIDs.
Learning Bite
Avoid steroids as first line treatment in idiopathic uncomplicated pericarditis
Pitfall
Discharging someone from ED without an echocardiogram means that not all poor prognostic indicators have been excluded and that an incomplete assessment has been made. Following a normal echocardiogram a patient may be discharged with NSAIDs if otherwise well.
(iii) Brugada Syndrome:
This is a rare but serious cause of ST segment elevation without AMI. It is an autosomal dominant condition with incomplete penetrance that has an incidence ranging from 5 to 66 per 10 000. It is endemic in Southeast Asia13.
Clinical features include: episodes of arrhythmia (usually rapid polymorphic VT), collapse or sudden death. The episodes are more common in the night or the early hours of the morning. There may be a family history of sudden death. It has a male predominance (ratio 8:1).
There are 3 types, each with specific ECG appearances (see Figure 9). These ECG findings can be dynamic and can be unmasked or exaggerated by sodium channel blockers such as flecainide. Brugada Syndrome is not associated with identifiable structural cardiac abnormalities.
ST segment elevation occurs in the right precordial leads V1 to V3. The exact morphology of the ST segment gives rise to the 3 types (see Table 5).
Table 5: Morphology of Brugada Syndrome types

Figure 9: ECG characteristics of Brugada Syndrome:

If Type 1 ECG morphology is demonstrated there is no need for drug testing but this is not the case in Types 2 and 3 where sodium channel blockers are used to confirm the diagnosis. In view of the potentially catastrophic nature of this disease inpatient referral is mandatory if Brugada syndrome is suspected to be the cause of ST elevation.
Learning Bite
Consider Brugada Syndrome in anyone with downward sloping ST segment elevation in the right precordial chest leads
Pitfall
Be cautious of ruling out Brugada Syndrome in someone who gives you a good history just because they do not have the characteristic Type 1 ECG changes. Remember the use of drug testing.
(iv) Ventricular aneurysm:
The majority of ventricular aneurysms are seen after large anterior myocardial infarctions14. This diagnosis may be indicated by the clinical history and the presence of previously recorded discharge ECGs. The commonest site of ST segment elevation is in the anterior leads reflecting the most likely site of the original STEMI. Clinical and ECG features will be static unlike those of a patient presenting with an acute STEMI. The other ECG characteristics can be seen Table 6.
Table 6: ECG characteristics associated with ventricular aneurysm

(v) Left Bundle Branch Block (LBBB):
The appearance of LBBB on an ECG makes any further interpretation of the ECG difficult. There are various features that allow you to “read through” LBBB to identify an acute STEMI: Sgarbossa15 described 3 independent ECG signs suggestive of AMI in a patient with LBBB on their ECG (see Table 6). These are highly specific but not sensitive for AMI and so have limited use in everyday clinical practice. Much more importance is attached to a good history for AMI.
Table 7: Sgarbossa Criteria
- 1lead with >_1mm concordant ST elevation
- 1lead of V1-V3 with >_1mm concordant ST depression
- 1lead anywhere with >_1mm ST elevation and proportionally excessive discordant ST elevation as defined by >_25% of the depth of the preceding s wave
Learning Bite
A patient presenting with a good history of AMI and with LBBB on their ECG should be treated as an AMI even in the absence of the Sgarbossa criteria
Extra emphasis has been placed on those conditions which may have STEMI as a differential diagnosis.
(i) Pulmonary Embolism (PE):
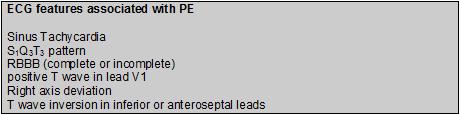
ECG changes associated with significant PE reflect right ventricular strain (due to outflow obstruction) and are mainly in the inferior and anteroseptal leads. In addition to ST segment elevation (which is an unusual finding in PE), there are other ECG findings that are associated with PE (see Table 8). ST elevation generally persists approx. 2/52. Persistence thereafter could represent Ventricular Aneurysm.
Table 8: ECG features associated with PE16
The presence of right ventricular dysfunction indicates a poorer prognosis and it has been suggested that these specific ECG findings can be used as an independent predictor of outcome17.
(ii) Hyperkalaemia:
Tenting of the T waves is the classic appearance associated with hyperkalaemia; however ST segment elevation may also be seen. This is characteristically downward sloping10. Other features of hyperkalaemia include widening of the QRS complex and low amplitude or absent P waves. These changes resolve as hyperkalaemia is treated. PR segment prolongation is another typical sign.
(iii) Subarachnoid Haemorrhage:
25% of people with SAH have ECG findings consistent with MI or ischaemia18. T wave inversion is the most common abnormality found, followed by ST segment depression, ST segment elevation and Q waves. Changes are commonly in an anterior distribution or may be diffuse. QT Prolongation and increased U wave amplitude are further signs.
Learning Bite
Non-specific ST segment changes are associated with SAH in 25% of cases
Summary Table: ECG changes associated with conditions causing ST segment elevation
| ST Shape | Site | P wave PR depression |
Reciprocal Changes |
Q waves | T waves | |
STEMI (Dynamic) |
Convex | Territorial | Common | Will develop | Hyperacute Large Amplitude |
|
Pericarditis (Dynamic Slower) |
Concave/ Saddle Shape |
Global | PR depression | aVR not aVL | No | ST:T wave ratio > 0.25 |
BER |
Concave Notch at J point |
Mostly Chest Leads | aVR in 50% | No | May have large amplitude | |
Ventricular Aneurysm (Static) |
Mainly Anterior | May be present | Anterior | Small amplitude | ||
Brugada Syndrome |
Downward Sloping | V1 and V2 | No | No | Normal | |
LBBB |
Anterior & Inferior Discordant to QRS normally |
Present | As part of the LBB pattern | May have large amplitude | ||
Pulmonary Embolism |
Changes normally Antero septal & inferior | Inverted in Inferior or anteroseptal leads | ||||
Hyperkalaemia |
Downward sloping | Low amplitude or Absent | Tall tented T waves | |||
SAH |
Anterior or Diffuse | Maybe present | May have T wave inversion |
- There are many causes of ST segment elevation which are unrelated to myocardial infarction.
- ST segment elevation is measured from the TP baseline to the J point.
- ST segment elevation is defined as >0.1 mV above the baseline and is measured at the J point.
- There are features on the ECG (eg. morphology, distribution and amplitude of ST segment elevation) that can help to establish the underlying diagnosis.
- BER is a normal finding in young males (Level of evidence Grade 2b).
- Convex shaped ST segment elevation is more likely to indicate STEMI (Level of evidence Grade 2b).
- Ventricular aneurysm, like STEMI, manifests as ST segment elevation that is territorial in distribution; however, unlike STEMI, it is static.
- An ST:T wave height ratio in lead V6 >0.25 is typically associated with pericarditis (Level of evidence Grade 3b).
- Brugada Syndrome has 3 types; in Type 1 the ECG findings are diagnostic; Types 2 and 3 need to have further evaluation to unmask the ECG findings.
- The presence of Sgarbossa criteria with LBBB makes STEMI likely but the absence of the Sgarbossa criteria does not rule out STEMI (Level of evidence Grade 2a).
- Otto LA, Aufderheide TP. Evaluation of ST segment elevation criteria for the prehospital electrocardiographic diagnosis fo acute myocardial infarction. Ann Emerg Med. 1994 Jan;23(1):17-24.
- Turnipseed SD, Bair AE, Kirk JD, et al. Electrocardiogram differentiation of benign early repolarization versus acute myocardial infarction by emergency physicians and cardiologists. Acad Emerg Med. 2006 Sep;13(9):961-6.
- Mehta MC, Jain AC. Early repolarization on scalar electrocardiogram. Am J Med Sci. 1995 Jun;309(6):305-11. doi: 10.1097/00000441-199506000-00001.
- Thygesen K, Alpert JS, et al. Universal definition of myocardial infarction. Eur Heart J. 2007 Oct;28(20):2525-38.
- Carley SD, Gamon R, Driscoll PA, Brown G, Wallman P. What’s the point of ST elevation? Emerg Med J. 2002 Mar;19(2):126-8.
- Brady WJ, Syverud SA, Beagle C, Perron AD, et al. Electrocardiographic ST-segment elevation: the diagnosis of acute myocardial infarction by morphologic analysis of the ST segment. Acad Emerg Med. 2001 Oct;8(10):961-7.
- Morris F, Edhouse J, Brady WJ, Camm J: (2003) ABC of Clinical Electrocardiography BMJ Books.
- HISS RG, LAMB LE, ALLEN MF. Electrocardiographic findings in 67,375 asymptomatic subjects. X. Normal values. Am J Cardiol. 1960 Jul;6:200-31.
- Ginzton LE, Laks MM. The differential diagnosis of acute pericarditis from the normal variant: new electrocardiographic criteria. Circulation. 1982 May;65(5):1004-9.
- Wang K, Asinger RW, Marriott HJ. ST-segment elevation in conditions other than acute myocardial infarction. N Engl J Med. 2003 Nov 27;349(22):2128-35.
- Mehta M, Jain AC, Mehta A. Early repolarization. Clin Cardiol. 1999 Feb;22(2):59-65.
- Lange RA, Hillis LD. Clinical practice. Acute pericarditis. N Engl J Med. 2004 Nov 18;351(21):2195-202.
- Wilde AA, Antzelevitch C, Borggrefe M, Brugada J, Brugada R, Brugada P, et al. Proposed diagnostic criteria for the Brugada syndrome: consensus report. Circulation. 2002 Nov 5;106(19):2514-9.
- Brady, William J. MD; Harrigan, et al. Diagnosis: Left Ventricular Aneurysm. Emergency Medicine News 28(6):p 38, June 2006.
- Sgarbossa EB, Pinski SL, Barbagelata A, et al. Electrocardiographic diagnosis of evolving acute myocardial infarction in the presence of left bundle-branch block. GUSTO-1 (Global Utilization of Streptokinase and Tissue Plasminogen Activator for Occluded Coronary Arteries) Investigators. N Engl J Med. 1996 Feb 22;334(8):481-7.
- Sreeram N, Cheriex EC, Smeets JL, Gorgels AP, Wellens HJ. Value of the 12-lead electrocardiogram at hospital admission in the diagnosis of pulmonary embolism. Am J Cardiol. 1994 Feb 1;73(4):298-303.
- Geibel A, Zehender M, Kasper w, Olschewski M, Klima C, Konstantinides SV. Prognostic value of the ECG on admission in patients with acute major pulmonary embolism. European Respiratory Journal; 2005. 25: pp.843-848.
- Zaroff JG, Rordorf GA, Newell JB, Ogilvy CS, Levinson JR. Cardiac outcome in patients with subarachnoid hemorrhage and electrocardiographic abnormalities. Neurosurgery. 1999 Jan;44(1):34-9; discussion 39-40.
- Cheng TO. Pseudoinfarctions. Circulation; 2001. 103; pp.e68.

Acute Pericarditis
This session looks at the risk stratification and management of patients with acute pericarditis.

Acute Coronary Syndromes
This session is about the pathophysiology of acute coronary syndromes, defining acute myocardial infarction and recognising the various presentations and clinical features associated with acute coronary syndromes.
Acute Coronary Syndromes: Pathophysiology and Presentation
This session is about the pathophysiology of acute coronary syndromes, and recognising the various presentations and clinical features associated with them.
7 Comments
very useful
very useful
thanks
Great learning session
Excellent point , great learning
excellent
Concise and clear., a handy pocket knowledge that is always useful